Background
Freshwater species and habitats are, on average around the world, more imperiled than their terrestrial counterparts. Yet, large-scale conservation planning efforts have rarely targeted freshwater biodiversity. This inattention is due in part to the fact that, compared to better-studied terrestrial taxa, there has been a severe lack of comprehensive, synthesized data on the distributions of freshwater species. Existing worldwide species-level data have covered only the largest river basins or select hotspots, rather than all inland waters. Additionally, these data syntheses have made little attempt to describe biogeographic patterns. Freshwater Ecoregions of the World (FEOW) is a collaborative project providing the first global biogeographic regionalization of the Earth’s freshwater biodiversity, and synthesizing biodiversity and threat data for the resulting ecoregions. We define a freshwater ecoregion as a large area encompassing one or more freshwater systems that contains a distinct assemblage of natural freshwater communities and species. The freshwater species, dynamics, and environmental conditions within a given ecoregion are more similar to each other than to those of surrounding ecoregions and together form a conservation unit. The freshwater ecoregion map serves as a complement to the global terrestrial and marine ecoregion maps and differs from them in that freshwater species (primarily fish) and freshwater processes drove the map delineation. A detailed description of the delineation methodology is available in Abell et al. (2008) (click here to download; 6 MB).
The Map
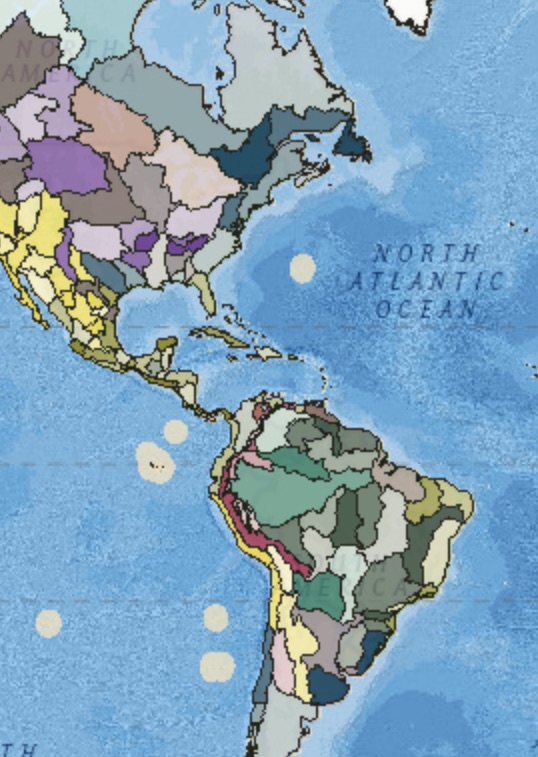
The freshwater ecoregion map encompasses 426 units, whose boundaries generally – though not always – correspond with those of watersheds (also known as drainage basins or catchments). Within individual ecoregions there will be turnover of species, such as when moving up or down a river system, but taken as a whole an ecoregion will typically have a distinct evolutionary history and/or ecological processes. Ecoregions are delineated based on the best available information, but data describing freshwater species and ecological processes are characterized by marked gaps and variation in quality, and improved information in the future may warrant map revisions.
Ecoregional Data
The biodiversity data synthesized for ecoregions include richness and endemism numbers for freshwater fish, amphibians, turtles, and crocodiles, derived in nearly all cases from either species lists or digital distribution data. Additional information about species will be found within the individual ecoregion descriptions, which also will include details on ecoregion boundaries, topography, climate, habitats, ecological and evolutionary phenomena, and other features. Threat analyses include examination of land cover conversion, the presence of large cities, urban land cover, area equipped for irrigation, human footprint, and water stress. These analyses are based on global datasets and examine threats through the lens of freshwater systems and species.
Conservation Applications
The freshwater ecoregion map encompasses 426 units, whose boundaries generally – though not always – correspond with those of watersheds (also known as drainage basins or catchments). Within individual ecoregions there will be turnover of species, such as when moving up or down a river system, but taken as a whole an ecoregion will typically have a distinct evolutionary history and/or ecological processes. Ecoregions are delineated based on the best available information, but data describing freshwater species and ecological processes are characterized by marked gaps and variation in quality, and improved information in the future may warrant map revisions.